Cost Per Signed Contract for Roofers
Cost per signed contract is the total marketing spend divided by the number of roofing contracts signed in a period, so it shows what each closed job actually cost to win from SEO.

Free Roofing SEO ROI Audit
Most roofing sites track leads but never tie spend to signed jobs. Get a free audit that maps SEO cost against closed contracts so you see the true cost per signed contract.
What Is Cost Per Signed Contract?
Cost per signed contract is total marketing spend for a channel divided by the number of roofing contracts signed from that channel in the same period. It measures what a closed job costs, not what an inquiry costs.
The Formula
Spend divided by signed contracts. If SEO costs 3,000 dollars a month and closes 10 jobs, the cost per signed contract is 300 dollars.
Counts Closed Jobs Only
A lead that never signs does not count. The metric divides by signed contracts, so it reflects revenue, not raw inquiry volume.
Per Channel
Calculate it separately for SEO, ads, and shared platforms so each channel reports its own true acquisition cost. Compare with cost per lead.
Why Does Cost Per Signed Contract Matter for Roofers?
It matters because cheap leads and high rankings mean nothing until they convert into signed jobs. Cost per signed contract is the metric that ties marketing spend to revenue.
A Cheap Lead Is Not a Cheap Job
- A channel with a low cost per lead can still produce a high cost per signed contract if few of those leads close.
- Close rate and lead quality sit inside this metric, where cost per lead ignores them.
- The number a roofer should manage to is the cost to win a job, not the cost to receive a phone call.
It Decides Where Budget Goes
- Comparing this number across channels shows which one wins jobs for the least spend.
- A high job value in roofing means a small change in cost per signed contract moves real profit.
- It turns a marketing line item into a profit decision. See the analytics hub.
How Is Cost Per Signed Contract Different From Cost Per Lead?
Cost per lead measures the price of an inquiry; cost per signed contract measures the price of a closed job, so it folds in close rate and lead quality. The two can point in opposite directions.
Cost Per Lead Counts Inquiries
It divides spend by every lead received, whether the homeowner was ready to hire or just gathering quotes.
Signed Contract Counts Jobs
It divides the same spend only by leads that became signed jobs, so a weak close rate raises the number.
Why They Disagree
A channel can have a higher cost per lead yet a lower cost per signed contract when its leads close at a stronger rate.
Measure the Cost to Win a Job
A roofing campaign can post cheap leads and still lose money if the jobs never close. We set up the tracking that ties SEO spend to signed contracts so you manage to profit, not vanity numbers.
Call Now For PricingOr call +1 272-207-3231
How to Calculate Cost Per Signed Contract
Calculate it in three steps: total the channel spend, count the contracts that channel signed, then divide spend by signed contracts. Keep the period and the channel the same on both sides.
The Three Inputs
- Total spend for the channel in the period, including retainer, content, and any tooling.
- The count of contracts signed that the channel sourced, taken from the CRM.
- A fixed window, such as a month or a quarter, so the two figures align.
A Worked Example
SEO spend of 3,000 dollars in a month that sourced 10 signed contracts gives a cost per signed contract of 300 dollars. The same 3,000 dollars on ads that sourced 5 jobs gives 600 dollars.
How to Attribute a Signed Contract to SEO
Attribution connects a signed job in the CRM back to the organic search visit that started it. Without that link, the contract count on the bottom of the formula is a guess.
Capture the First Touch
- A tracked call number on organic pages records which calls came from search.
- A hidden source field on the estimate form stores the channel with the lead.
- These feed the CRM so the source travels with the job to signing.
Close the Loop in the CRM
- Mark each job won or lost so signed contracts can be counted by source.
- Reconcile monthly against the calendar of jobs that closed.
- For the mechanics of tracking the inquiry, see lead attribution and call tracking.
Why Organic Leads Lower the Cost Per Signed Contract
Organic leads tend to lower the number because a homeowner who searched and chose your listing carries higher intent and closes at a stronger rate. Higher close rate divides the spend across more signed jobs.
Exclusive, Not Shared
An organic caller reaches you alone, where a shared-platform lead reaches several roofers at once and the close rate drops.
Higher Buyer Intent
The homeowner started the search and reached out on purpose, which tends to lift the close rate over a cold or interruptive lead.
Compounds Over Time
Rankings hold without a per-click charge, so as organic jobs accumulate the cost per signed contract trends down.
Comparing Channels by Cost Per Signed Contract
The fair comparison across channels is cost per signed contract, because close rate changes the real cost even when the cost per lead looks lower. Compare the closed-job cost, not the inquiry cost.
A Side-by-Side Example
- Ads at an 80 dollar cost per lead with a 10 percent close rate cost about 800 dollars per signed contract.
- SEO at a 150 dollar cost per lead with a 35 percent close rate cost about 428 dollars per signed contract.
- The channel with the higher cost per lead won the job for less, because more of its leads closed.
Read the Channels by Behavior
- Ads reset each month with no compounding and shared competition on the same queries.
- Shared platforms send one lead to several roofers, which presses close rates and margins.
- Referrals close at the highest rate but cannot be scaled on demand the way search can.
A Lower Cost Per Job Means More Profit
Shared roofing leads can run 50 to 150 dollars each and close at a low rate, which pushes the cost per signed contract up. An exclusive organic pipeline tends to win jobs for less over time.
Call Now For PricingOr call +1 272-207-3231
How Cost Per Signed Contract Connects to Revenue and ROI
Revenue from a channel equals leads multiplied by close rate multiplied by average job value, so cost per signed contract sits next to that figure to show return. One side is the cost to win, the other is the value won.
The Revenue Side
With 20 organic leads a month, a 30 percent close rate, and a 12,000 dollar average job, the channel produces about 72,000 dollars in monthly revenue. Set the cost to win each job against that.
The Commercial Case
Commercial roofing jobs can run 80,000 to 250,000 dollars, so a single extra signed contract from search can outweigh a year of spend. See revenue attribution.
Common Mistakes Measuring Cost Per Signed Contract
Roofers misread this metric through six recurring errors, each one fixable in how the data is collected and divided.
Counting and Attribution Errors
- Dividing by leads instead of signed contracts, which reports cost per lead by another name.
- No source field on the job, so contracts cannot be tied back to the channel.
- Crediting one channel for a job that several touchpoints influenced.
Window and Cost Errors
- Mismatched windows, where spend is monthly but contracts are counted over a quarter.
- Leaving content or tooling out of spend, which understates the true cost.
- Ignoring the sales-cycle lag, so a job counts in the wrong period from the lead.
How to Report Cost Per Signed Contract Over Time
Report the metric as a trend by month and by channel, not a single snapshot, because organic cost per signed contract falls as rankings mature. A trend shows the direction; one month hides it.
What to Put on the Report
- Cost per signed contract by month, with the channel labeled on each line.
- Signed contracts and spend shown beside the ratio so the inputs are visible.
- A rolling view so a slow month does not read as a failure.
Where It Lives
This metric belongs on the same dashboard as cost per lead and revenue so the picture is whole. See SEO reporting and KPI dashboards for the layout.
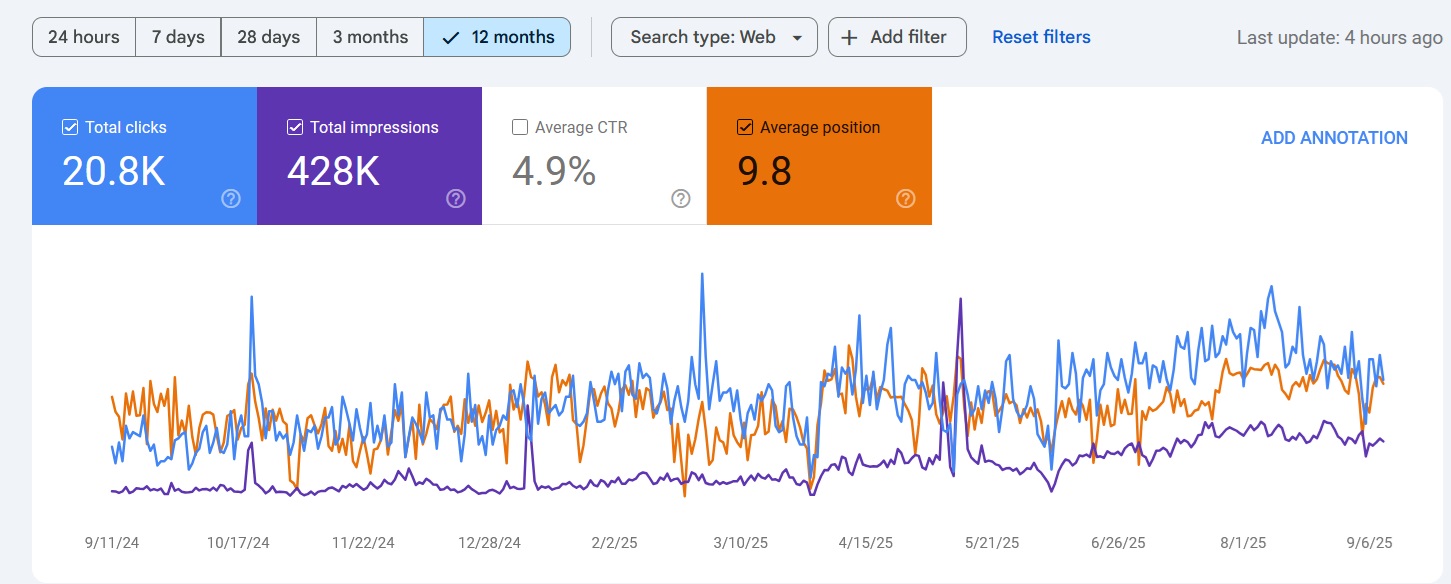
Proof of Performance
Results from roofing campaigns that rank in local search.
Map Pack Rankings
Ranked in Local Search Within 90 Days
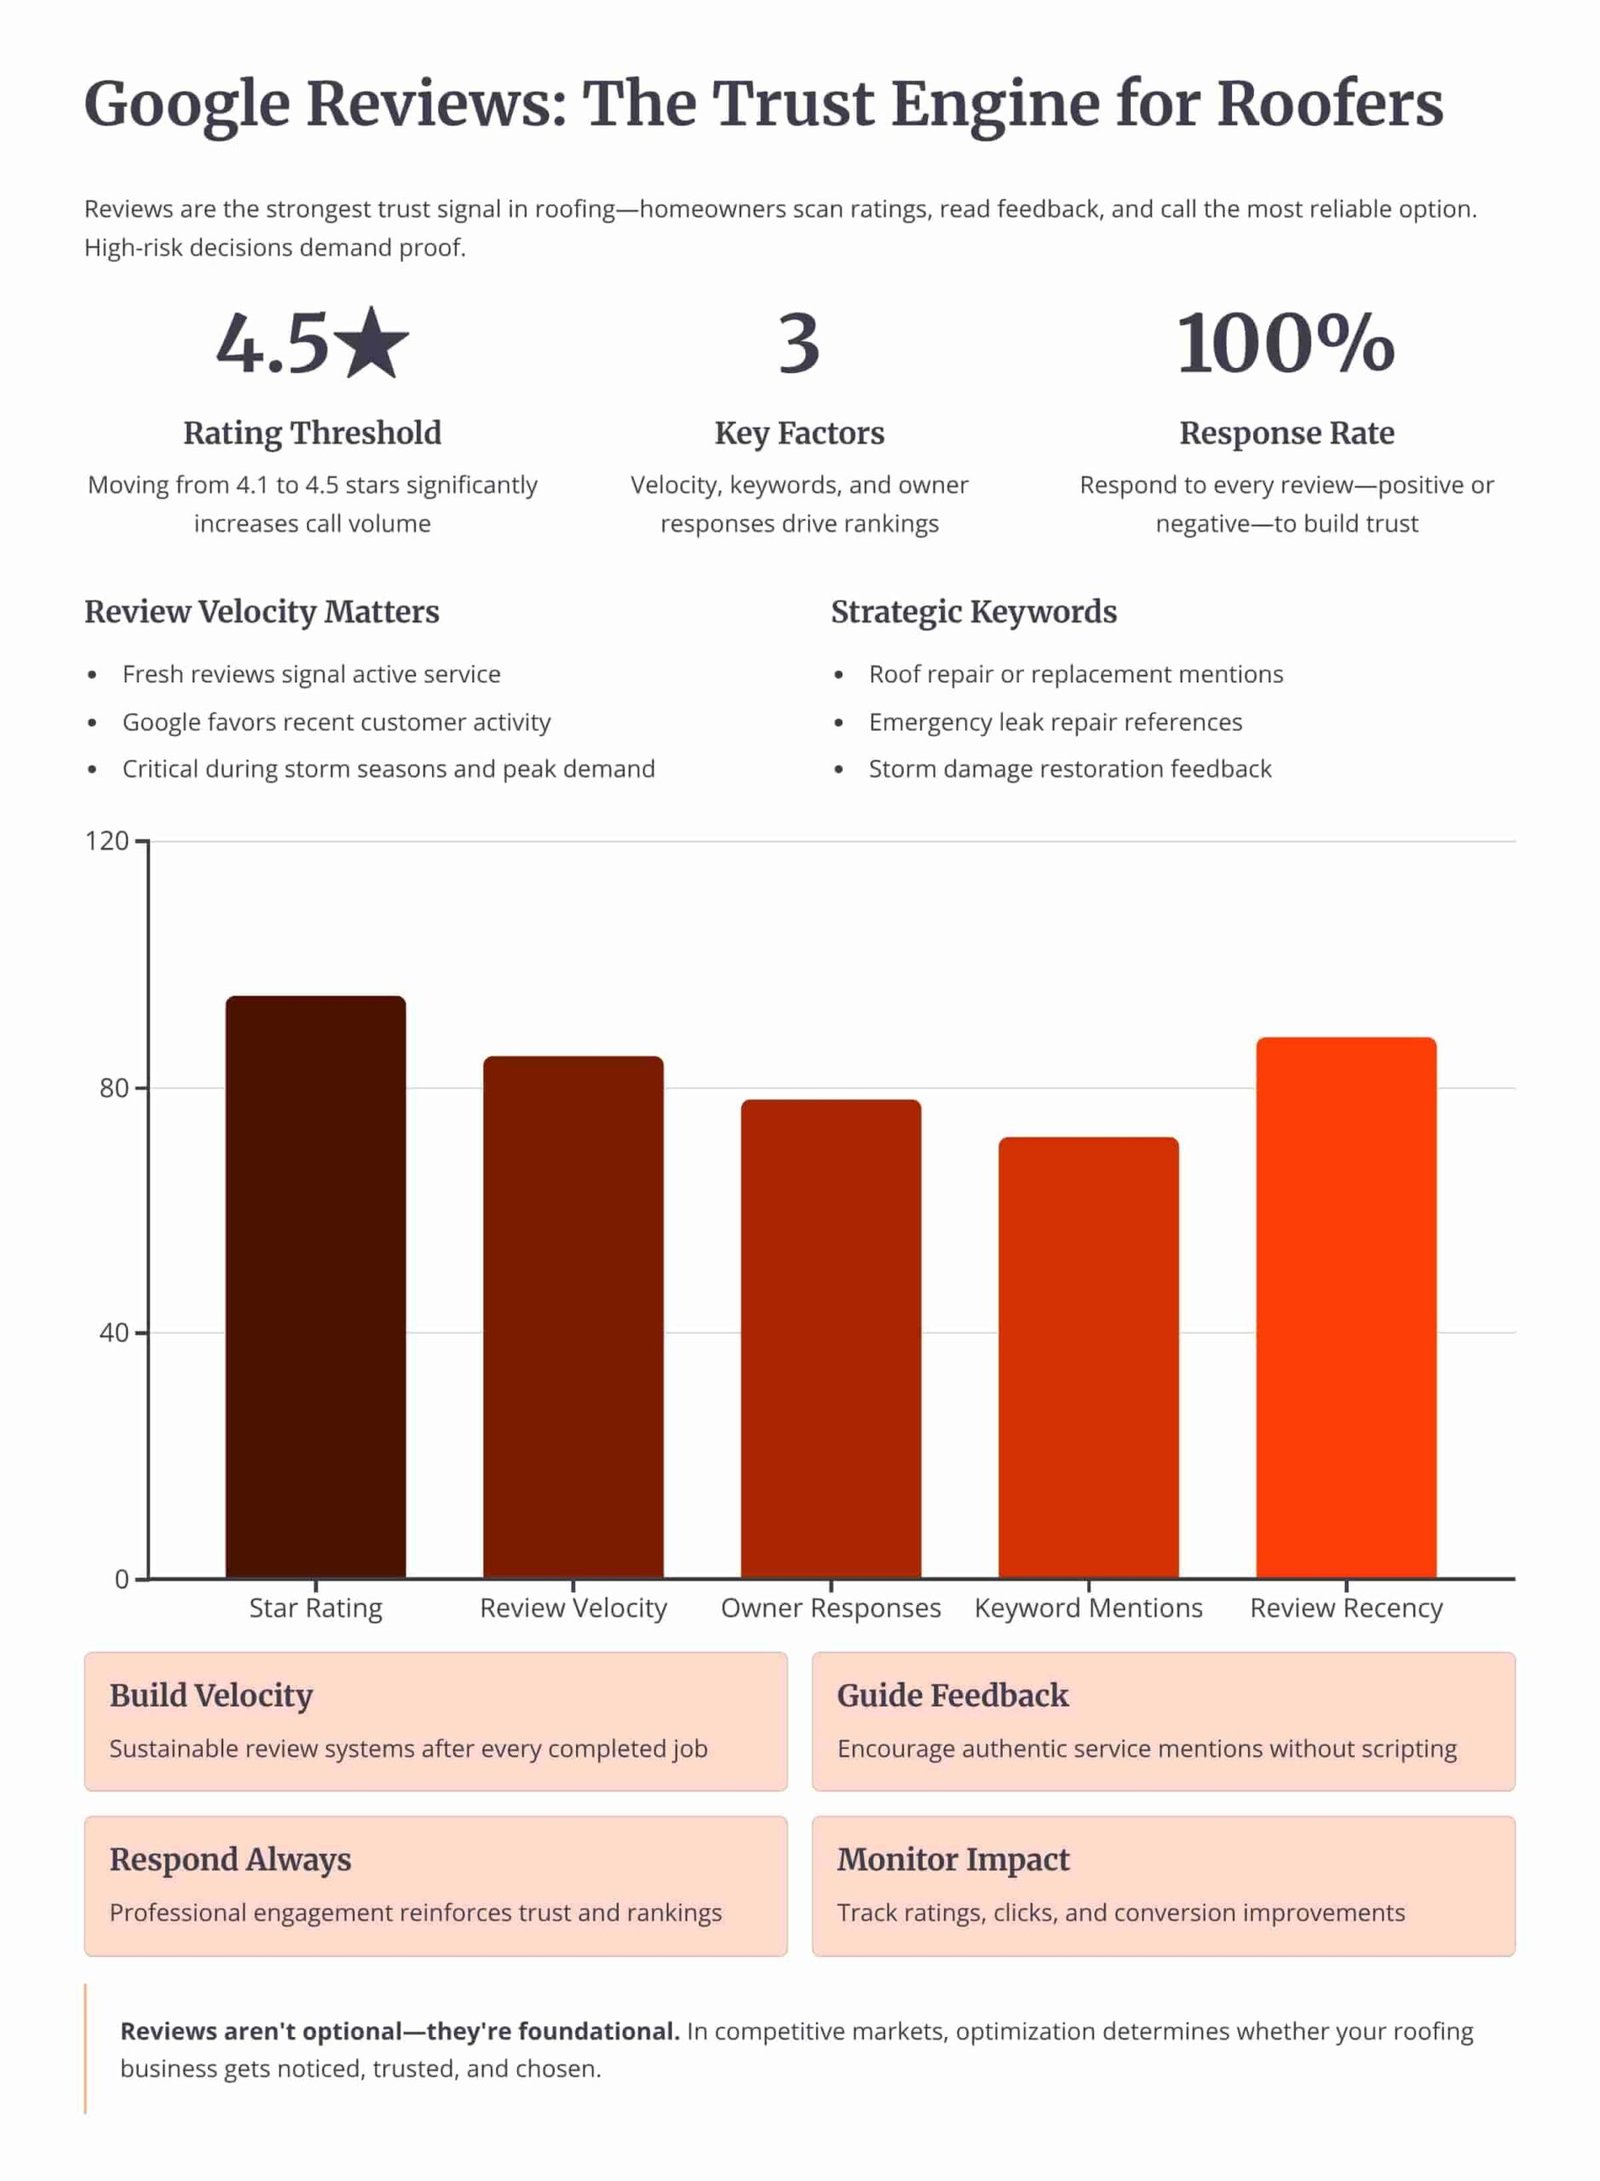
Review Velocity
150+ 5-Star Reviews Generated
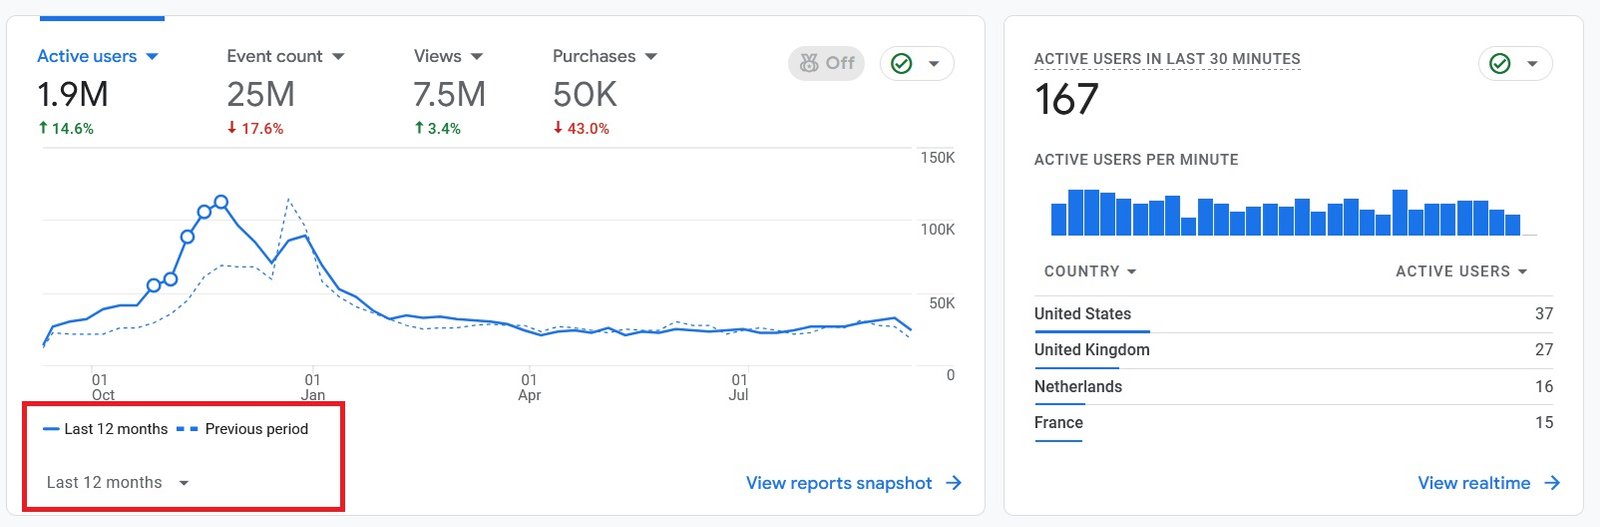
Organic Traffic
300% Increase in Qualified Traffic
What Roofers Say
The 180-Day Roofing SEO Roadmap
See how we optimize the profile, build the website, and earn local-pack rankings over a 6-month engagement.
Month 1: Profile Audit and Setup
- Category and Field Fixes: Setting the primary category, secondary categories, description, services, and service areas.
- NAP Cleanup: Correcting the name, address, and phone number across the profile, the website, and the directory citations.
Month 2: Reviews and Media
- Review System: Setting up a steady request flow and replying to every review, positive and negative.
- Photo and Post Cadence: Uploading job photos from each completed roof and publishing profile posts twice a month.
Month 4: Citations and Site Support
- Citation Building: Adding consistent listings on the directories that feed prominence for a service area.
- Service-Area Pages: Building city pages on the website that reinforce the profile's service areas.
Month 6: Local-Pack Rankings and Leads
- Map-Pack Position: Reaching the top 3 of the local pack for core roofing queries in the served cities.
- Lead Tracking: Measuring calls and direction requests from the profile against the cost of paid leads.
Owning Search Demand vs Renting It From Lead Platforms
If you pay Angi or Google Ads, you are renting visibility. The moment you stop paying, your pipeline dries up. Ranking the profile and the website for high-intent local searches builds permanent digital equity.
Shared Lead Platforms (Angi, HomeAdvisor)
- The Race to the Bottom: Shared leads force you to slash prices to win against 5 other roofers.
- Low Intent: Half the time they aren't ready to buy, they were just clicking around online.
Local Search SEO (Our Approach)
- 100% exclusive, direct-to-you inbound calls.
- Highest closing rate. They chose YOU from the local pack.
- Compounding ROI. You don't pay per click.
We Identify Search Intent Using Industry-Leading Data Tools


Expertise Built on Data.
Not Guesswork.
I'm Nizam Ud Deen, and I don't build generic websites. I build search intent engines specifically for the roofing industry.
For years, I've watched roofers burn money on agencies that brag about "traffic" while the phones stay silent. Traffic without intent is worthless. My system maps exactly how homeowners search during storms, when comparing prices, and when they're ready to buy, and intercepts them at every stage.
The No-Brainer Roofing SEO Guarantee
We don't guarantee "traffic" or "rankings." We guarantee high-intent leads.
"We guarantee to generate 15 exclusive, inbound replacement or repair leads per month within the first 180 days, driven entirely by high-intent organic search. If we don't hit that metric, we work for free until we do."
Measuring Success: Leads and Revenue
We don't report on vanity metrics. If traffic goes up but revenue stays flat, the strategy failed. We track the pipeline.
Call Tracking
Every keyword mapped to the exact phone call it generated.
Form Fills
Tracking estimate requests from high-intent local landing pages.
Booked Jobs
Connecting CRM data to SEO efforts to prove actual revenue return.
Cost per Lead
Monitoring organic CPL to ensure it beats shared platform costs.
The Cost Per Signed Contract Tracking Checklist
Run your roofing measurement setup through this checklist to confirm every signed job ties back to the channel that won it.
Frequently Asked Questions
Clear answers about measuring cost per signed contract for roofing SEO.
What is cost per signed contract?
How is it different from cost per lead?
How do I calculate cost per signed contract?
What is a good cost per signed contract for roofers?
Can cost per lead and cost per signed contract disagree?
How do I attribute a signed contract to SEO?
Why do organic leads lower the cost per signed contract?
Does this metric account for the average job value?
How does the sales-cycle lag affect the number?
Should commercial and residential be measured separately?
What spend should I include in the calculation?
How often should I report this metric?
Where does this metric belong on a dashboard?
Does conversion optimization change this metric?
Get Your Free Roofing SEO ROI Audit
We'll map your SEO spend against signed contracts and compare it to your paid channels so you see the true cost per signed contract and where the pipeline leaks.
What You Get:
- Spend-to-Contract ReviewA check of how your SEO spend ties to signed jobs across the period.
- Attribution Gap ScanA list of jobs with no source field, where the channel cannot be traced.
More Deliverables
- Channel ComparisonCost per signed contract for SEO set beside your paid and shared channels.
- Tracking PlanThe call, form, and CRM setup needed to measure the metric cleanly.
Claim your free roofing SEO ROI audit today. No commitment required.