KPI Dashboards for Roofers
Build one dashboard that pulls traffic, lead, and revenue metrics into a single view, so you can read roofing SEO performance at a glance and act on it the same week.

Free Roofing KPI Dashboard Review
Most roofing reports track traffic and rankings while leaving revenue out of view. Get a free review of your current metrics with the leaks that hide your true SEO return.
What Is a Roofing KPI Dashboard?
A roofing KPI dashboard is a single view that pulls traffic, lead, and revenue metrics from your analytics, call tracking, and CRM into one place, so you read SEO performance without opening four tools. It turns scattered numbers into one decision surface.
One View, Many Sources
The dashboard reads from Google Analytics, call tracking, and the CRM, so every metric sits on one screen instead of in separate exports.
Decision, Not Just Report
A report shows what happened last month. A dashboard shows the same numbers often enough that you can act on a drop the same week it appears.
Built for Roofing
A roofing dashboard tracks calls and booked jobs, not page views alone, because most homeowners call rather than fill a form. See the analytics hub.
Why Does Standard Roofing Reporting Fail?
Standard roofing reporting fails because it tracks too many metrics, never connects them to revenue, scatters them across tools, and leaves no one accountable for any single number.
Where the Report Breaks
- Too many metrics on one screen, so nothing reads as a clear signal.
- Rankings and traffic shown with no link to signed contracts.
- Data split across analytics, call tracking, and the CRM, compiled by hand.
- No named owner for any metric, so a drop sits unanswered.
What a Dashboard Fixes
- A short list of metrics replaces the wall of numbers.
- Each lead is traced to a booked job through revenue attribution.
- One screen reads from every source, so nothing is compiled by hand.
- Every metric has an owner and a threshold that triggers a review.
Vanity Metrics vs Real KPIs
A vanity metric looks impressive but does not move the business, while a real KPI ties to a lead or a booked job. Page views and impressions read well, yet they do not pay for a crew.
Vanity Metrics to Demote
- Total page views with no path to a call or a form.
- Search impressions counted without click-through.
- Keyword positions shown alone, with no lead behind them.
- Social followers that never enter the pipeline.
Real KPIs to Promote
- Organic leads per month, the count of qualified inquiries.
- Cost per lead, the SEO spend divided by those leads.
- Lead-to-inspection rate and inspection-to-contract close rate.
- Revenue attributed to organic search.
Track the Metrics That Pay for Crews
A dashboard full of traffic charts can hide a stalled pipeline. We build the view that ties each organic lead to the job it became, so you measure return, not noise.
Call Now For PricingOr call +1 272-207-3231
Which KPIs Belong on a Roofing Dashboard?
Group the metrics into four categories: marketing, sales, operations, and financial. Each category answers a different question, and together they read as one funnel from search to signed job.
Marketing and Sales KPIs
- Organic leads per month and cost per lead.
- Google Business Profile calls, tracked separate from site calls.
- Lead-to-inspection rate and inspection-to-contract close rate.
- Bid-hit ratio, average job value, and sales cycle length.
Operational and Financial KPIs
- Crew productivity, measured in squares installed per hour.
- Job completion time, actual against estimate.
- Job profitability, revenue minus labor, materials, and overhead.
- Monthly revenue from SEO and customer acquisition cost.
How Many KPIs Should a Dashboard Hold?
Hold the core dashboard to 8 to 12 metrics. Past that count the screen turns into a report no one reads, and a real signal hides among the noise.
8 to 12 Core Metrics
A focused set keeps the dashboard readable. Each metric earns its place by tying to a lead, a job, or a cost.
Match KPIs to Stage
Early on, weight lead volume and cost per lead. As the system matures, add close rate, then margin and acquisition cost.
Give Each a Threshold
Every metric needs a line that triggers action. A close rate below 35 percent, for example, calls a review of the proposal and the follow-up.
How Do You Read Organic Leads and Cost per Lead?
Organic leads per month counts qualified inquiries from organic search alone, and cost per lead divides the monthly SEO spend by that count. Read them together to judge whether the spend produces the pipeline.
Organic Leads per Month
Separate organic from paid, referral, and direct, so the count reflects search only. If 200 organic visitors yield 3 leads, the page has a conversion problem, not a traffic problem. See lead attribution.
Cost per Lead
Divide the total monthly SEO investment by organic leads produced. After 6 to 12 months a mature system tends to reach a lower cost per lead than paid channels. See cost per lead.
How Do You Track the Conversion Funnel?
Track two gates: lead-to-inspection rate and inspection-to-contract close rate. The first shows whether leads get booked; the second shows whether inspections become signed jobs.
Lead-to-Inspection Rate
The share of organic leads that turn into booked inspections, typically healthy in the 40 to 60 percent range. A rate below 35 percent points to response time or call handling, not lead volume.
Inspection-to-Contract Close Rate
The share of inspections that become signed contracts, often in the 35 to 55 percent range. Track it by sales rep, lead source, and job type to find the combinations that close.
How Do You Put Revenue on the Dashboard?
Revenue attribution is the layer that connects each organic lead to the contract it became and the gross margin on that job. Without it, a dashboard shows leads but never proves the return.
Three Inputs for SEO ROI
- The total monthly SEO investment.
- The total revenue from organic-attributed contracts.
- The average gross margin on those jobs.
Leads Must Trace to Jobs
If you cannot see which leads become roofing contracts, the screen is noise, not a dashboard. The CRM must carry the lead source from entry through to the signed value. See revenue attribution.
See Which Leads Became Jobs
Organic leads cost nothing per visit, against 50 to 150 dollars for shared roofing leads. We wire the CRM, the call tracking, and the analytics so the dashboard reads the full path from search to signed contract.
Call Now For PricingOr call +1 272-207-3231
Which Tools Feed a Roofing Dashboard?
Four sources feed the dashboard: a visualization layer, analytics, call tracking, and the CRM. Looker Studio joins them, and the CRM must capture the lead source at entry.
The Visualization and Data Layer
- Google Looker Studio joins the sources into one view.
- Google Analytics 4 supplies organic traffic and conversion events.
- Google Search Console adds query and click data. See Search Console.
The Lead and Revenue Layer
- Call tracking, such as CallRail or WhatConverts, attributes inbound calls by channel. See call tracking.
- A roofing CRM, such as JobNimbus or AccuLynx, holds lead status and contract value.
- The CRM tags the lead source at entry, or attribution breaks.
Why Does GA4 Configuration Decide Accuracy?
A misconfigured Google Analytics 4 property is the most common cause of inaccurate roofing KPI reporting. If the conversion events are wrong, every number downstream is wrong too.
Events the Dashboard Depends On
- Form submissions from estimate and contact pages.
- Call-button clicks on mobile, where most roofing intent lands.
- Quote requests, marked as conversion events.
- Organic traffic isolated by channel, not blended with paid.
Where Setup Goes Wrong
Untagged buttons, missing conversion events, and blended channels all feed the dashboard bad data. Setting up the form, the call button, and the offer itself lives in conversion optimization; the dashboard measures what those actions produce.
What Views Should the Dashboard Show?
Build four views, each on its own cadence: a daily leads view, a weekly funnel, a monthly revenue view, and a crew performance view. Each one shows only the metrics that timeframe and audience need.
Daily and Weekly Views
- Daily leads view: organic leads, GBP calls, and form fills, flagged against the weekly average.
- Weekly funnel: lead to booked inspection to signed contract, so a drop shows before it compounds.
Monthly and Operations Views
- Monthly revenue view: contract revenue split by organic, paid, referral, and direct.
- Crew performance view: productivity, completion time, and profitability by crew and job type.
How Do Action Thresholds Turn Data Into Decisions?
Attach a threshold to each metric, so a number crossing a line triggers a named action inside a set window. A threshold turns a chart into a decision instead of a thing to admire.
Lead-to-Inspection Below 35 Percent
The sales manager reviews call recordings within 48 hours to find where booked inspections are being lost.
Close Rate Below 35 Percent
The sales team meets to review proposal quality, pricing, and follow-up cadence before the dip carries into the month.
Cost per Lead Above Benchmark
An audit of the landing pages and the Google Business Profile follows within the week to bring the cost back in line.
Proof of Performance
Results from roofing campaigns that rank in local search.
Map Pack Rankings
Ranked in Local Search Within 90 Days
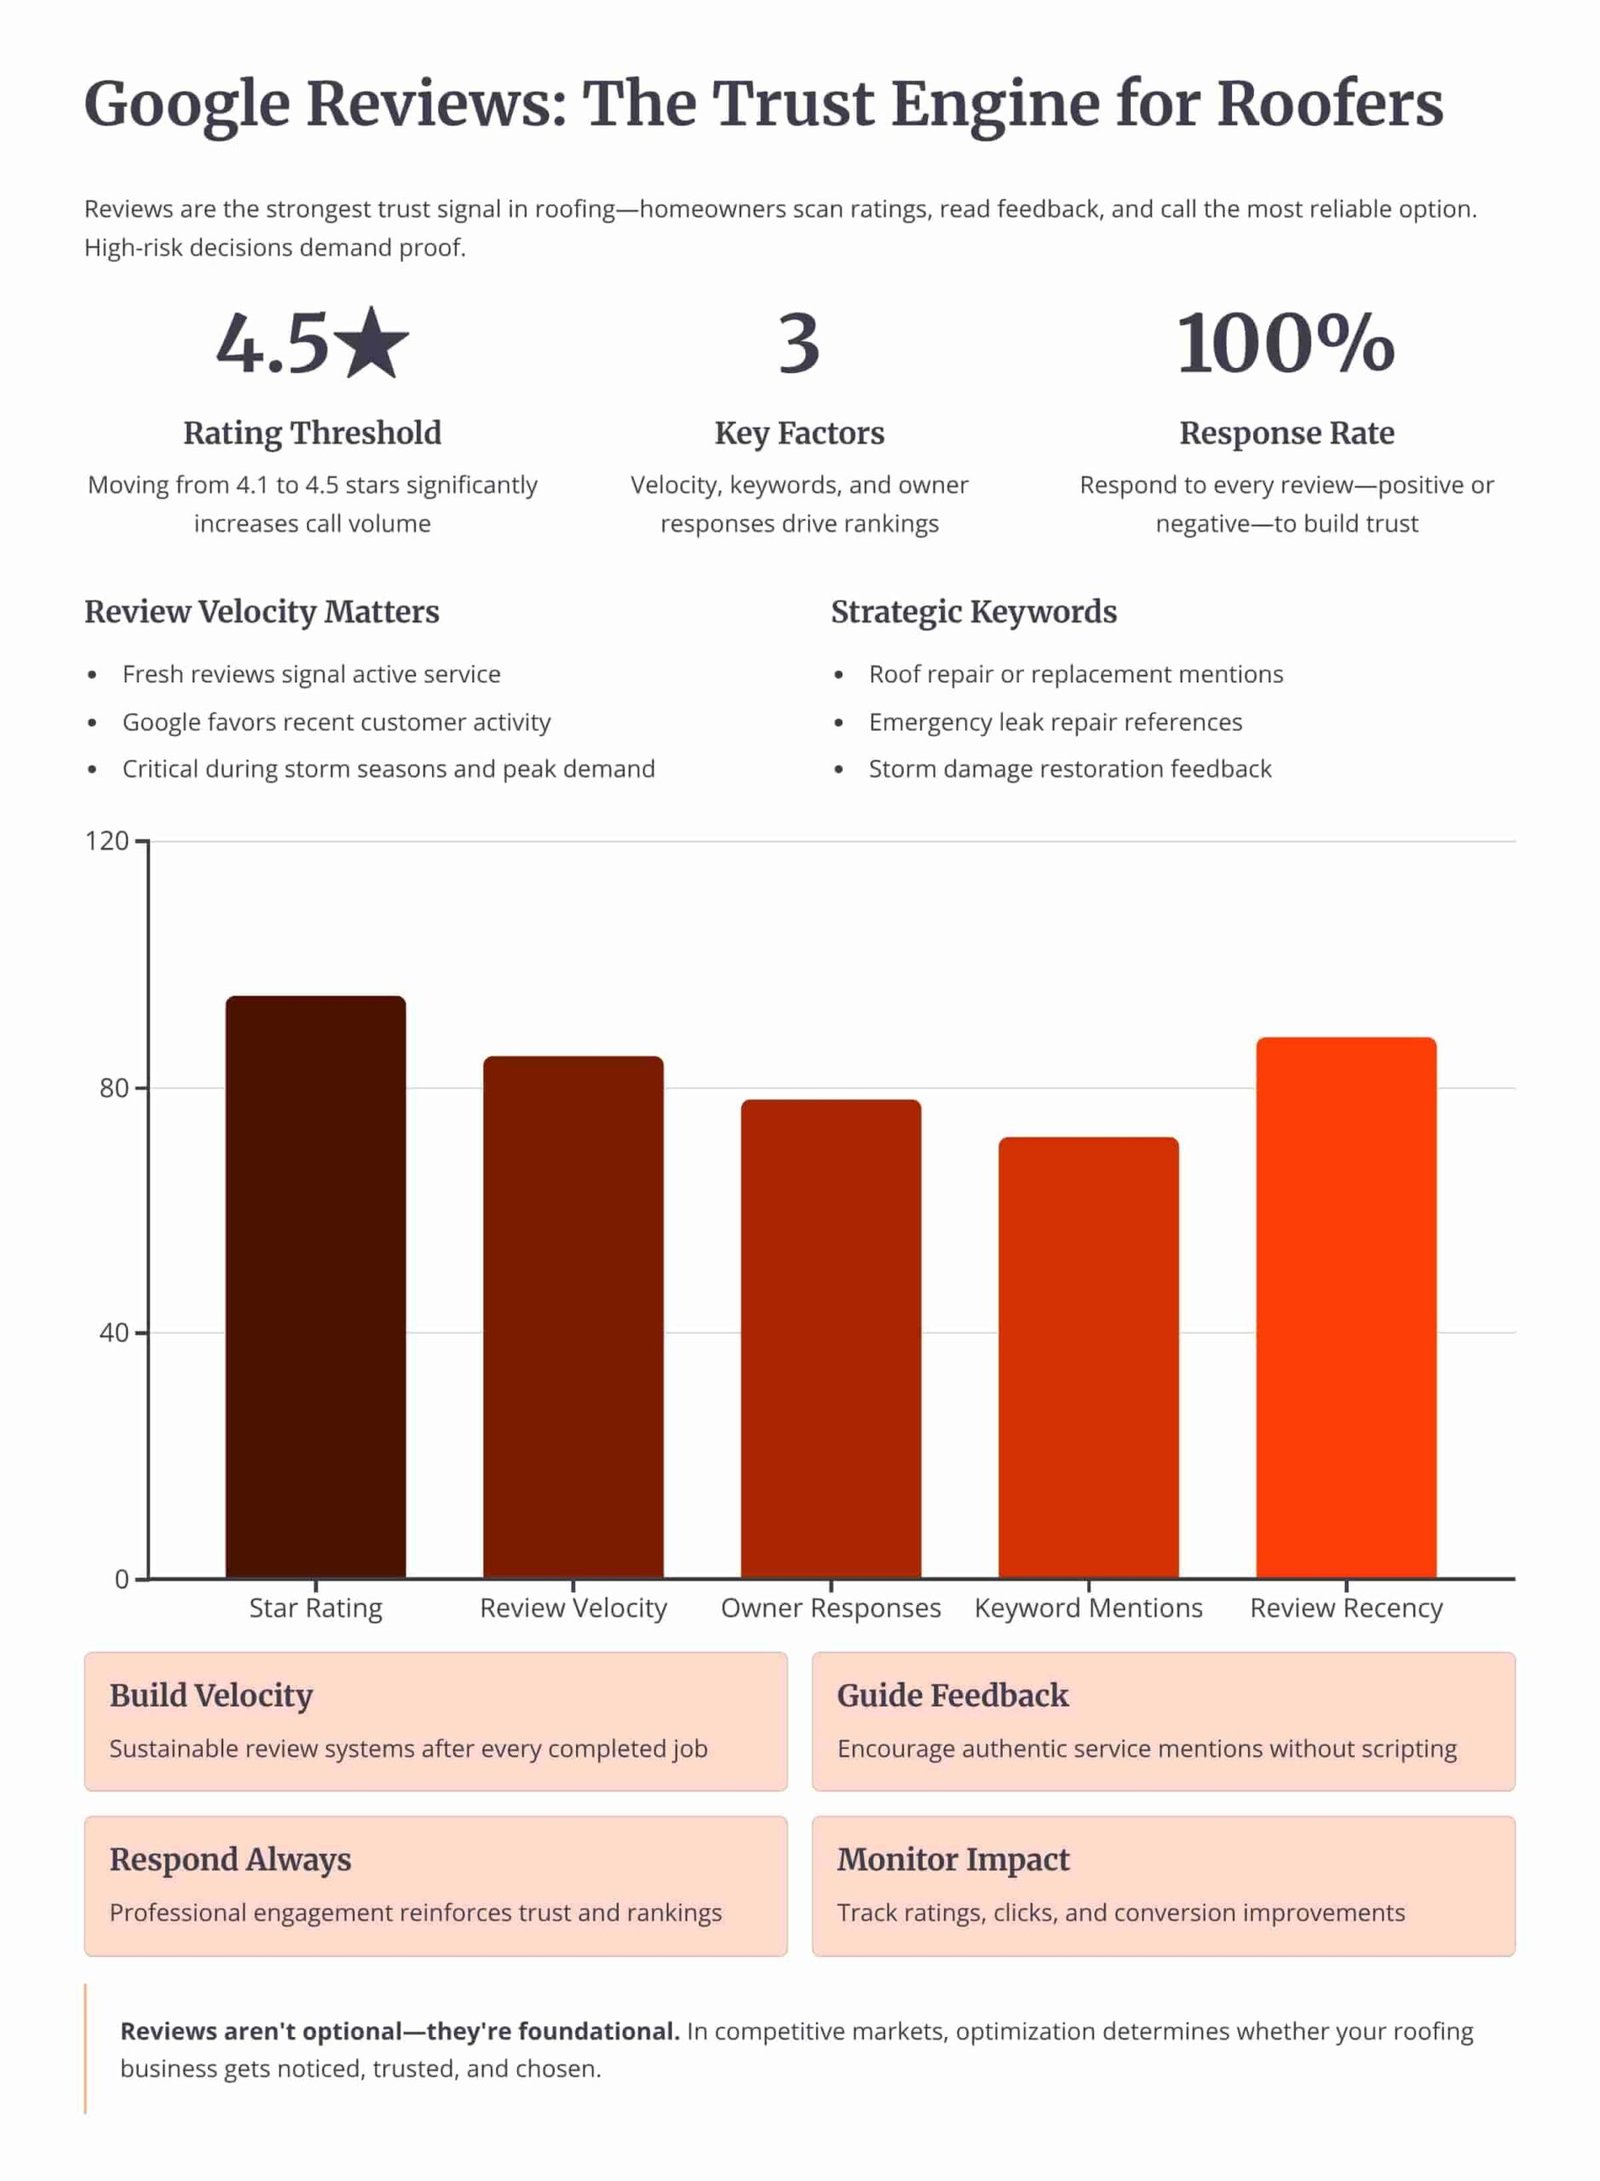
Review Velocity
150+ 5-Star Reviews Generated
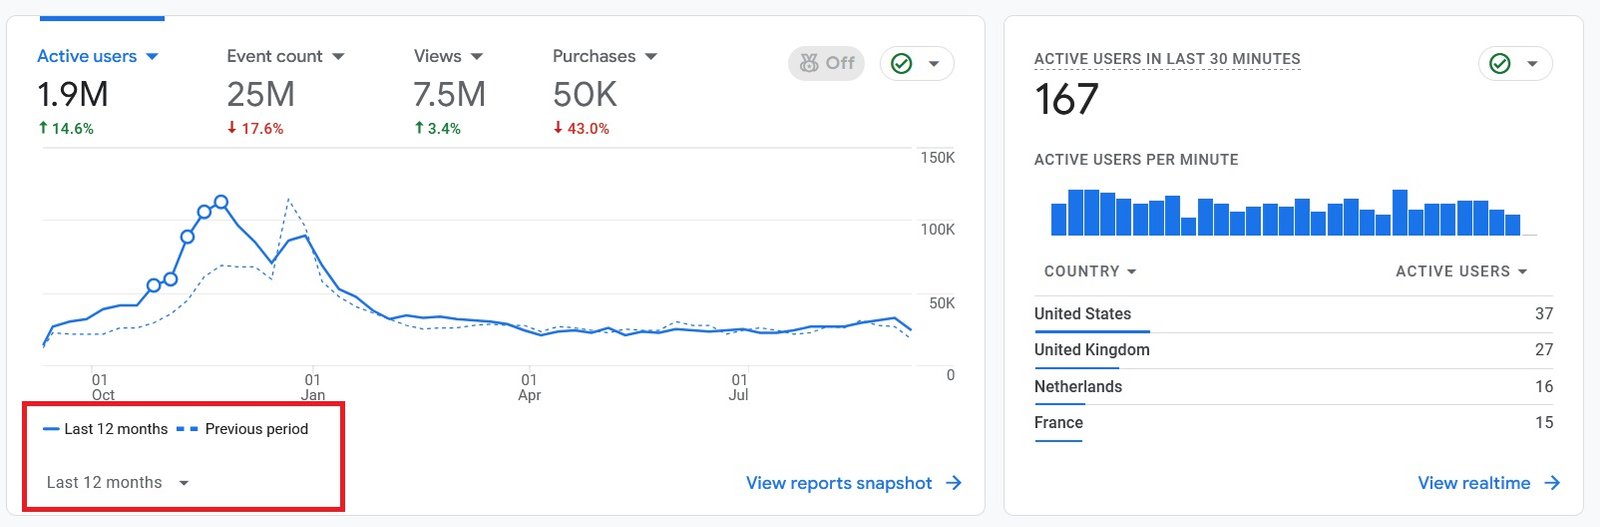
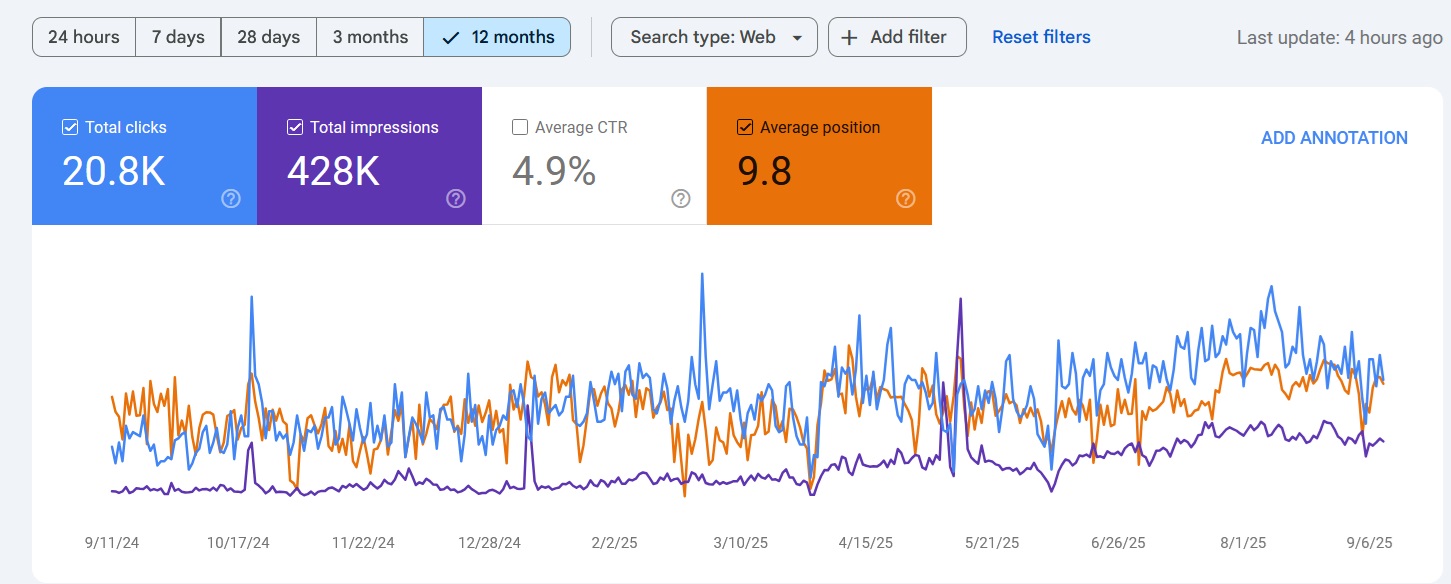
Organic Traffic
300% Increase in Qualified Traffic
What Roofers Say
The 180-Day Roofing SEO Roadmap
See how we optimize the profile, build the website, and earn local-pack rankings over a 6-month engagement.
Month 1: Profile Audit and Setup
- Category and Field Fixes: Setting the primary category, secondary categories, description, services, and service areas.
- NAP Cleanup: Correcting the name, address, and phone number across the profile, the website, and the directory citations.
Month 2: Reviews and Media
- Review System: Setting up a steady request flow and replying to every review, positive and negative.
- Photo and Post Cadence: Uploading job photos from each completed roof and publishing profile posts twice a month.
Month 4: Citations and Site Support
- Citation Building: Adding consistent listings on the directories that feed prominence for a service area.
- Service-Area Pages: Building city pages on the website that reinforce the profile's service areas.
Month 6: Local-Pack Rankings and Leads
- Map-Pack Position: Reaching the top 3 of the local pack for core roofing queries in the served cities.
- Lead Tracking: Measuring calls and direction requests from the profile against the cost of paid leads.
Owning Search Demand vs Renting It From Lead Platforms
If you pay Angi or Google Ads, you are renting visibility. The moment you stop paying, your pipeline dries up. Ranking the profile and the website for high-intent local searches builds permanent digital equity.
Shared Lead Platforms (Angi, HomeAdvisor)
- The Race to the Bottom: Shared leads force you to slash prices to win against 5 other roofers.
- Low Intent: Half the time they aren't ready to buy, they were just clicking around online.
Local Search SEO (Our Approach)
- 100% exclusive, direct-to-you inbound calls.
- Highest closing rate. They chose YOU from the local pack.
- Compounding ROI. You don't pay per click.
We Identify Search Intent Using Industry-Leading Data Tools


Expertise Built on Data.
Not Guesswork.
I'm Nizam Ud Deen, and I don't build generic websites. I build search intent engines specifically for the roofing industry.
For years, I've watched roofers burn money on agencies that brag about "traffic" while the phones stay silent. Traffic without intent is worthless. My system maps exactly how homeowners search during storms, when comparing prices, and when they're ready to buy, and intercepts them at every stage.
The No-Brainer Roofing SEO Guarantee
We don't guarantee "traffic" or "rankings." We guarantee high-intent leads.
"We guarantee to generate 15 exclusive, inbound replacement or repair leads per month within the first 180 days, driven entirely by high-intent organic search. If we don't hit that metric, we work for free until we do."
Measuring Success: Leads and Revenue
We don't report on vanity metrics. If traffic goes up but revenue stays flat, the strategy failed. We track the pipeline.
Call Tracking
Every keyword mapped to the exact phone call it generated.
Form Fills
Tracking estimate requests from high-intent local landing pages.
Booked Jobs
Connecting CRM data to SEO efforts to prove actual revenue return.
Cost per Lead
Monitoring organic CPL to ensure it beats shared platform costs.
The Roofing KPI Dashboard Build Checklist
Run your dashboard through this checklist to confirm it reads the full path from organic search to booked job.
Frequently Asked Questions
Clear answers about KPI dashboards for roofing SEO.
What is a KPI dashboard for a roofing company?
How many KPIs should a roofing dashboard track?
What is the difference between a vanity metric and a KPI?
Which KPIs matter most for roofing SEO?
What tools do I need to build a roofing dashboard?
How does a dashboard tie leads to revenue?
How often should I review a roofing KPI dashboard?
What is a healthy lead-to-inspection rate for roofers?
What is a good inspection-to-contract close rate?
Why is my KPI data inaccurate?
Do I need call tracking for a roofing dashboard?
Who should own each KPI on the dashboard?
How is a KPI dashboard different from an SEO report?
Can a mature dashboard help with seasonal planning?
Get Your Free Roofing KPI Dashboard Review
We'll review the metrics you track today and show where revenue drops out of view, so the dashboard reads the full path from organic search to booked job.
What You Get:
- Metric Gap AnalysisA check of which KPIs you track and which revenue metrics are missing.
- Attribution CheckA look at whether your CRM ties leads to booked jobs and contract value.
More Deliverables
- GA4 Configuration ReviewA scan of conversion events for calls, forms, and quote requests.
- Dashboard BlueprintA proposed set of 8 to 12 core KPIs with owners and thresholds.
Claim your free roofing KPI dashboard review today. No commitment required.